Spectrums with matplotlib
When you plot spectrums, it is very useful to use different colors and line widths to
differentiate between the lines. Here we show some ideas in order you can create good
and clean plots.
For the next examples we will use this data:
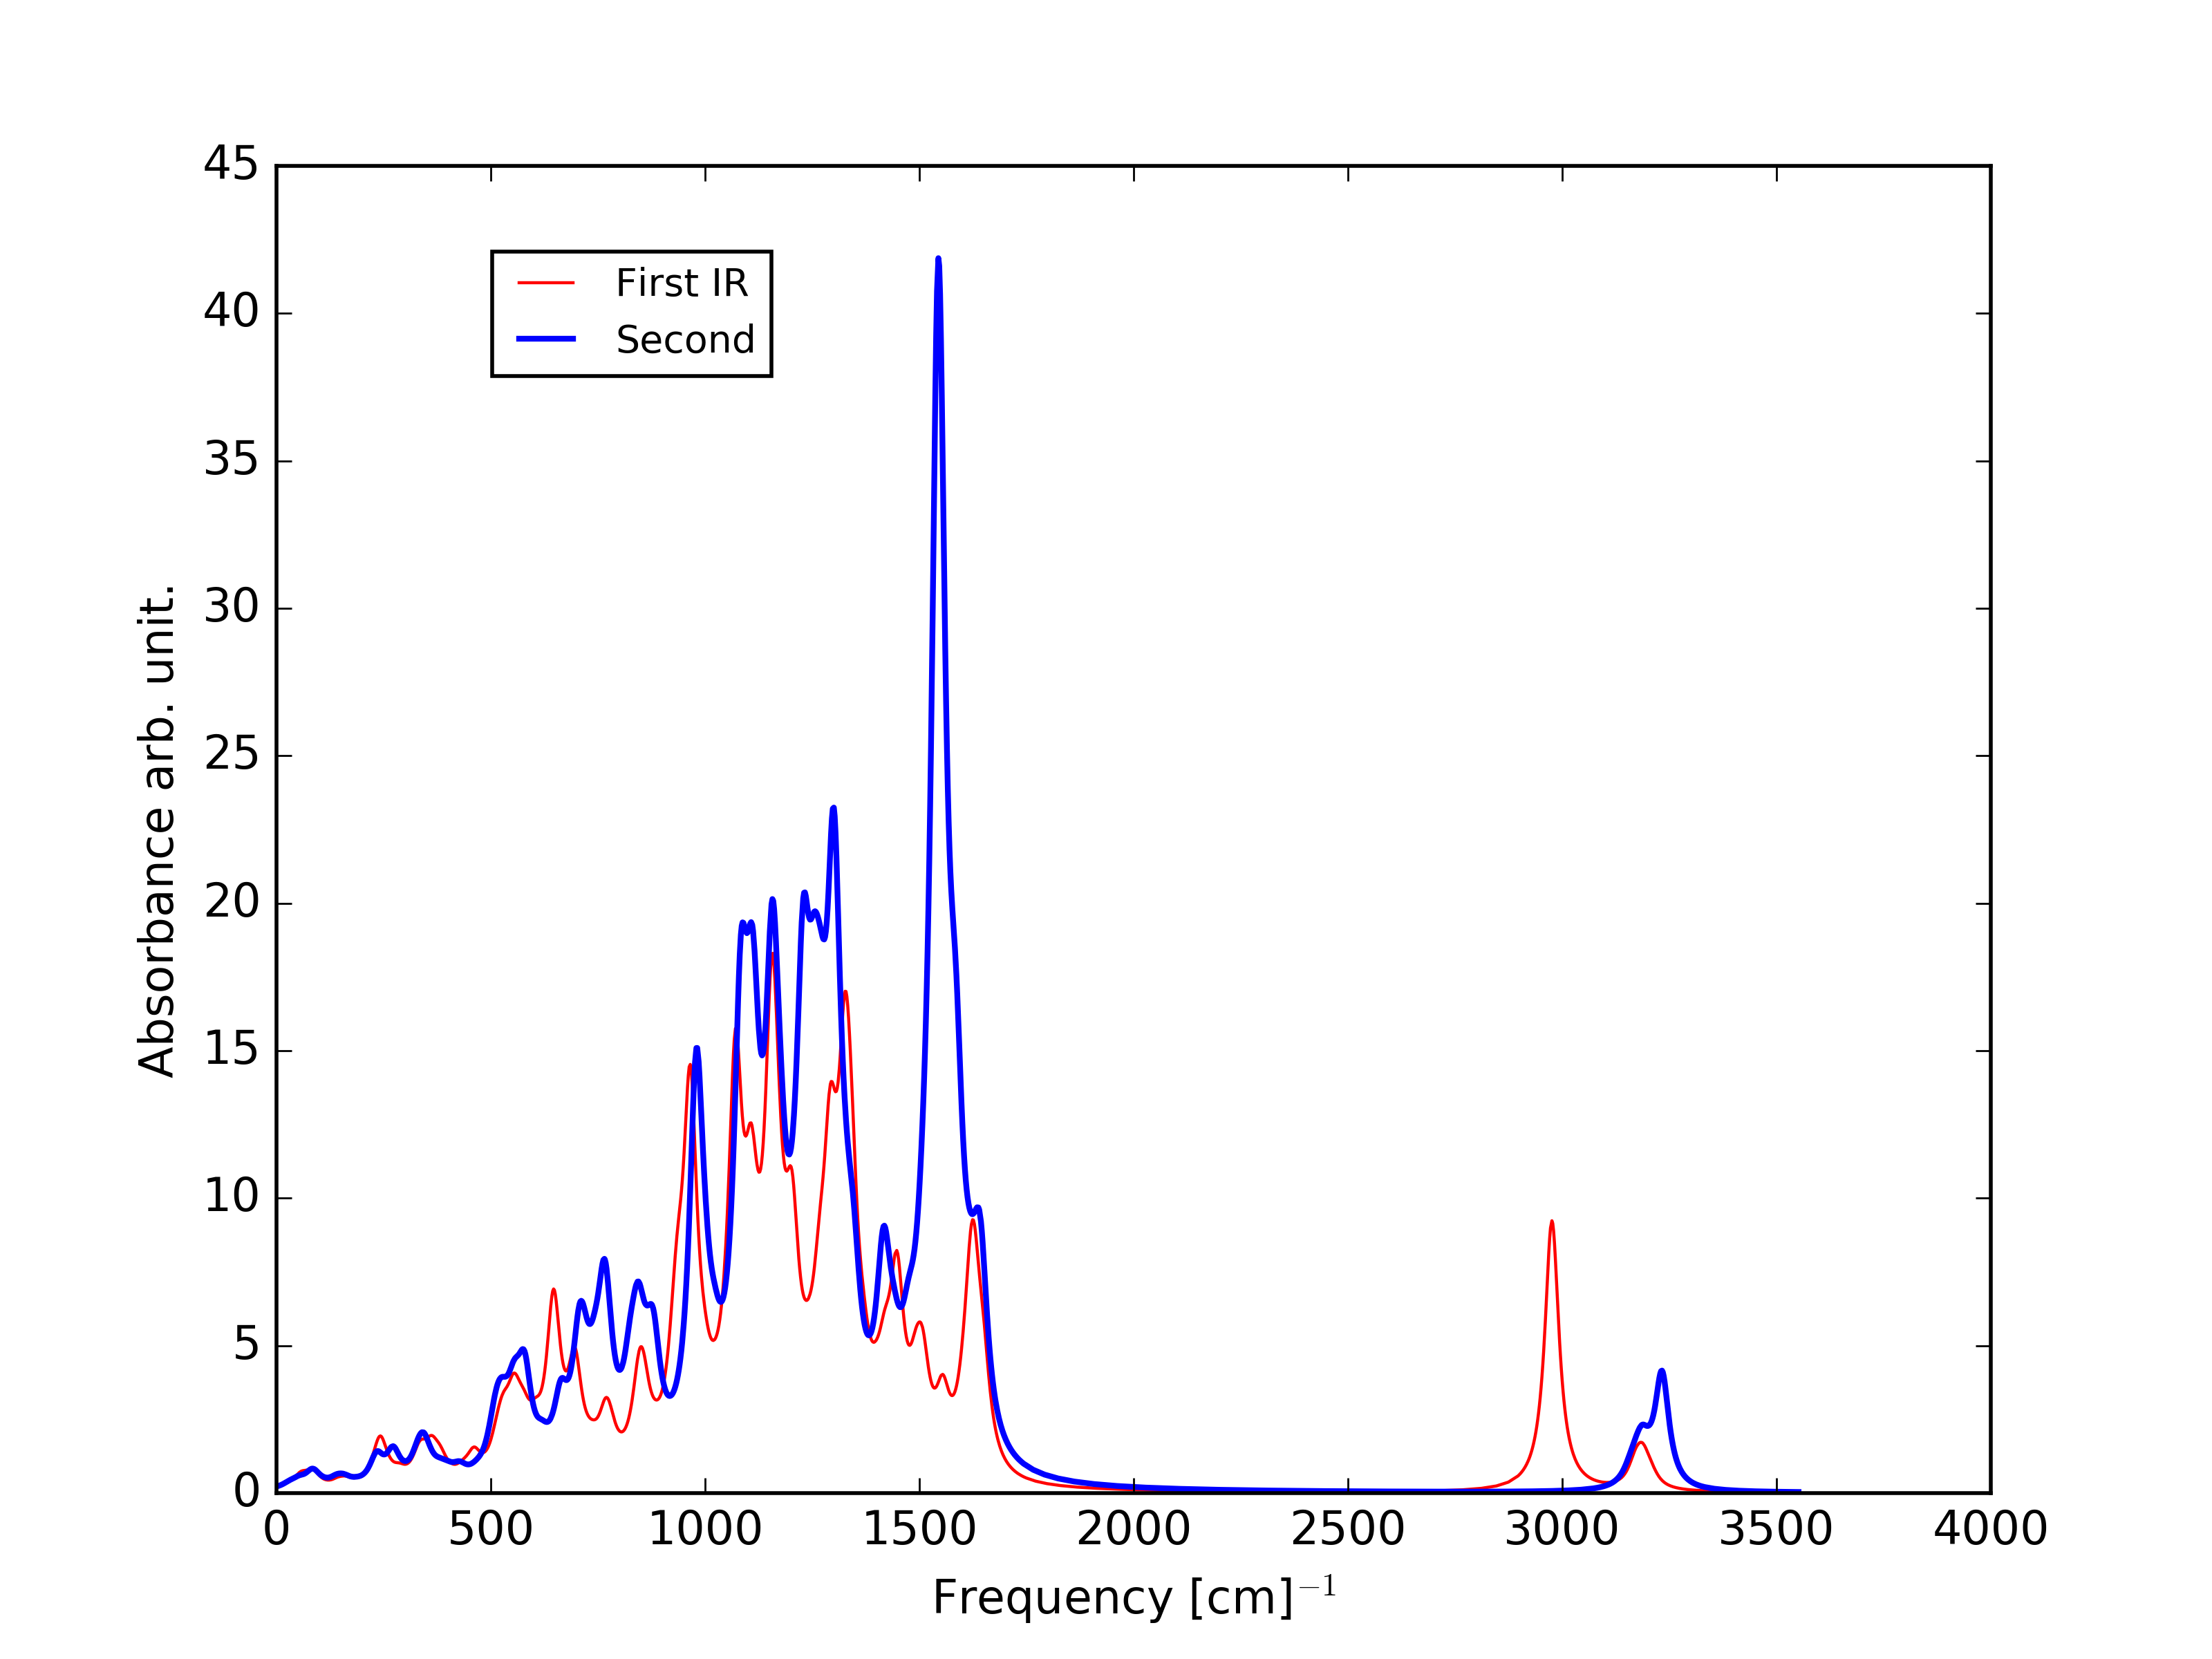
Different line width and color
To create different width and colors the plot function has 2 attributes, color and linewidth lw which can be modified very easy.
import matplotlib.pyplot as pl
import numpy as np
# Load data with numpy libraries
ir1 = np.loadtxt('first_ir.dat', delimiter=" ")
ir2 = np.loadtxt('second_ir.dat', delimiter=" ")
# Columns delimiters are simply blank spaces

#Plot Figure
#----------------------------------
fig = pl.figure(1)
ax1=pl.subplot()
ax1.plot(ir1[:,0], ir1[:,1], label=''First IR', lw='0.8', color='red')
ax1.plot(ir2[:,0], ir2[:,1], label=''Second IR', lw='3.2', color='blue')
# Plots the whole elements from column 0 [:,0] vs [:,1] of each file

# Axis Labels
pl.xlabel(r'Frequency [cm]$^{-1}$', x=0.5, y=0)
pl.ylabel('Absorbance arb. units', x=0, y=0.5)
pl.legend(loc=1, bbox_to_anchor=(0.30, 0.95),prop={'size':10})

#Intructions for the exit format: png, eps, ps, svg
#---------------------------------------------------
pl.savefig('ir_lines.png',format='png', dpi=400)
pl.show()
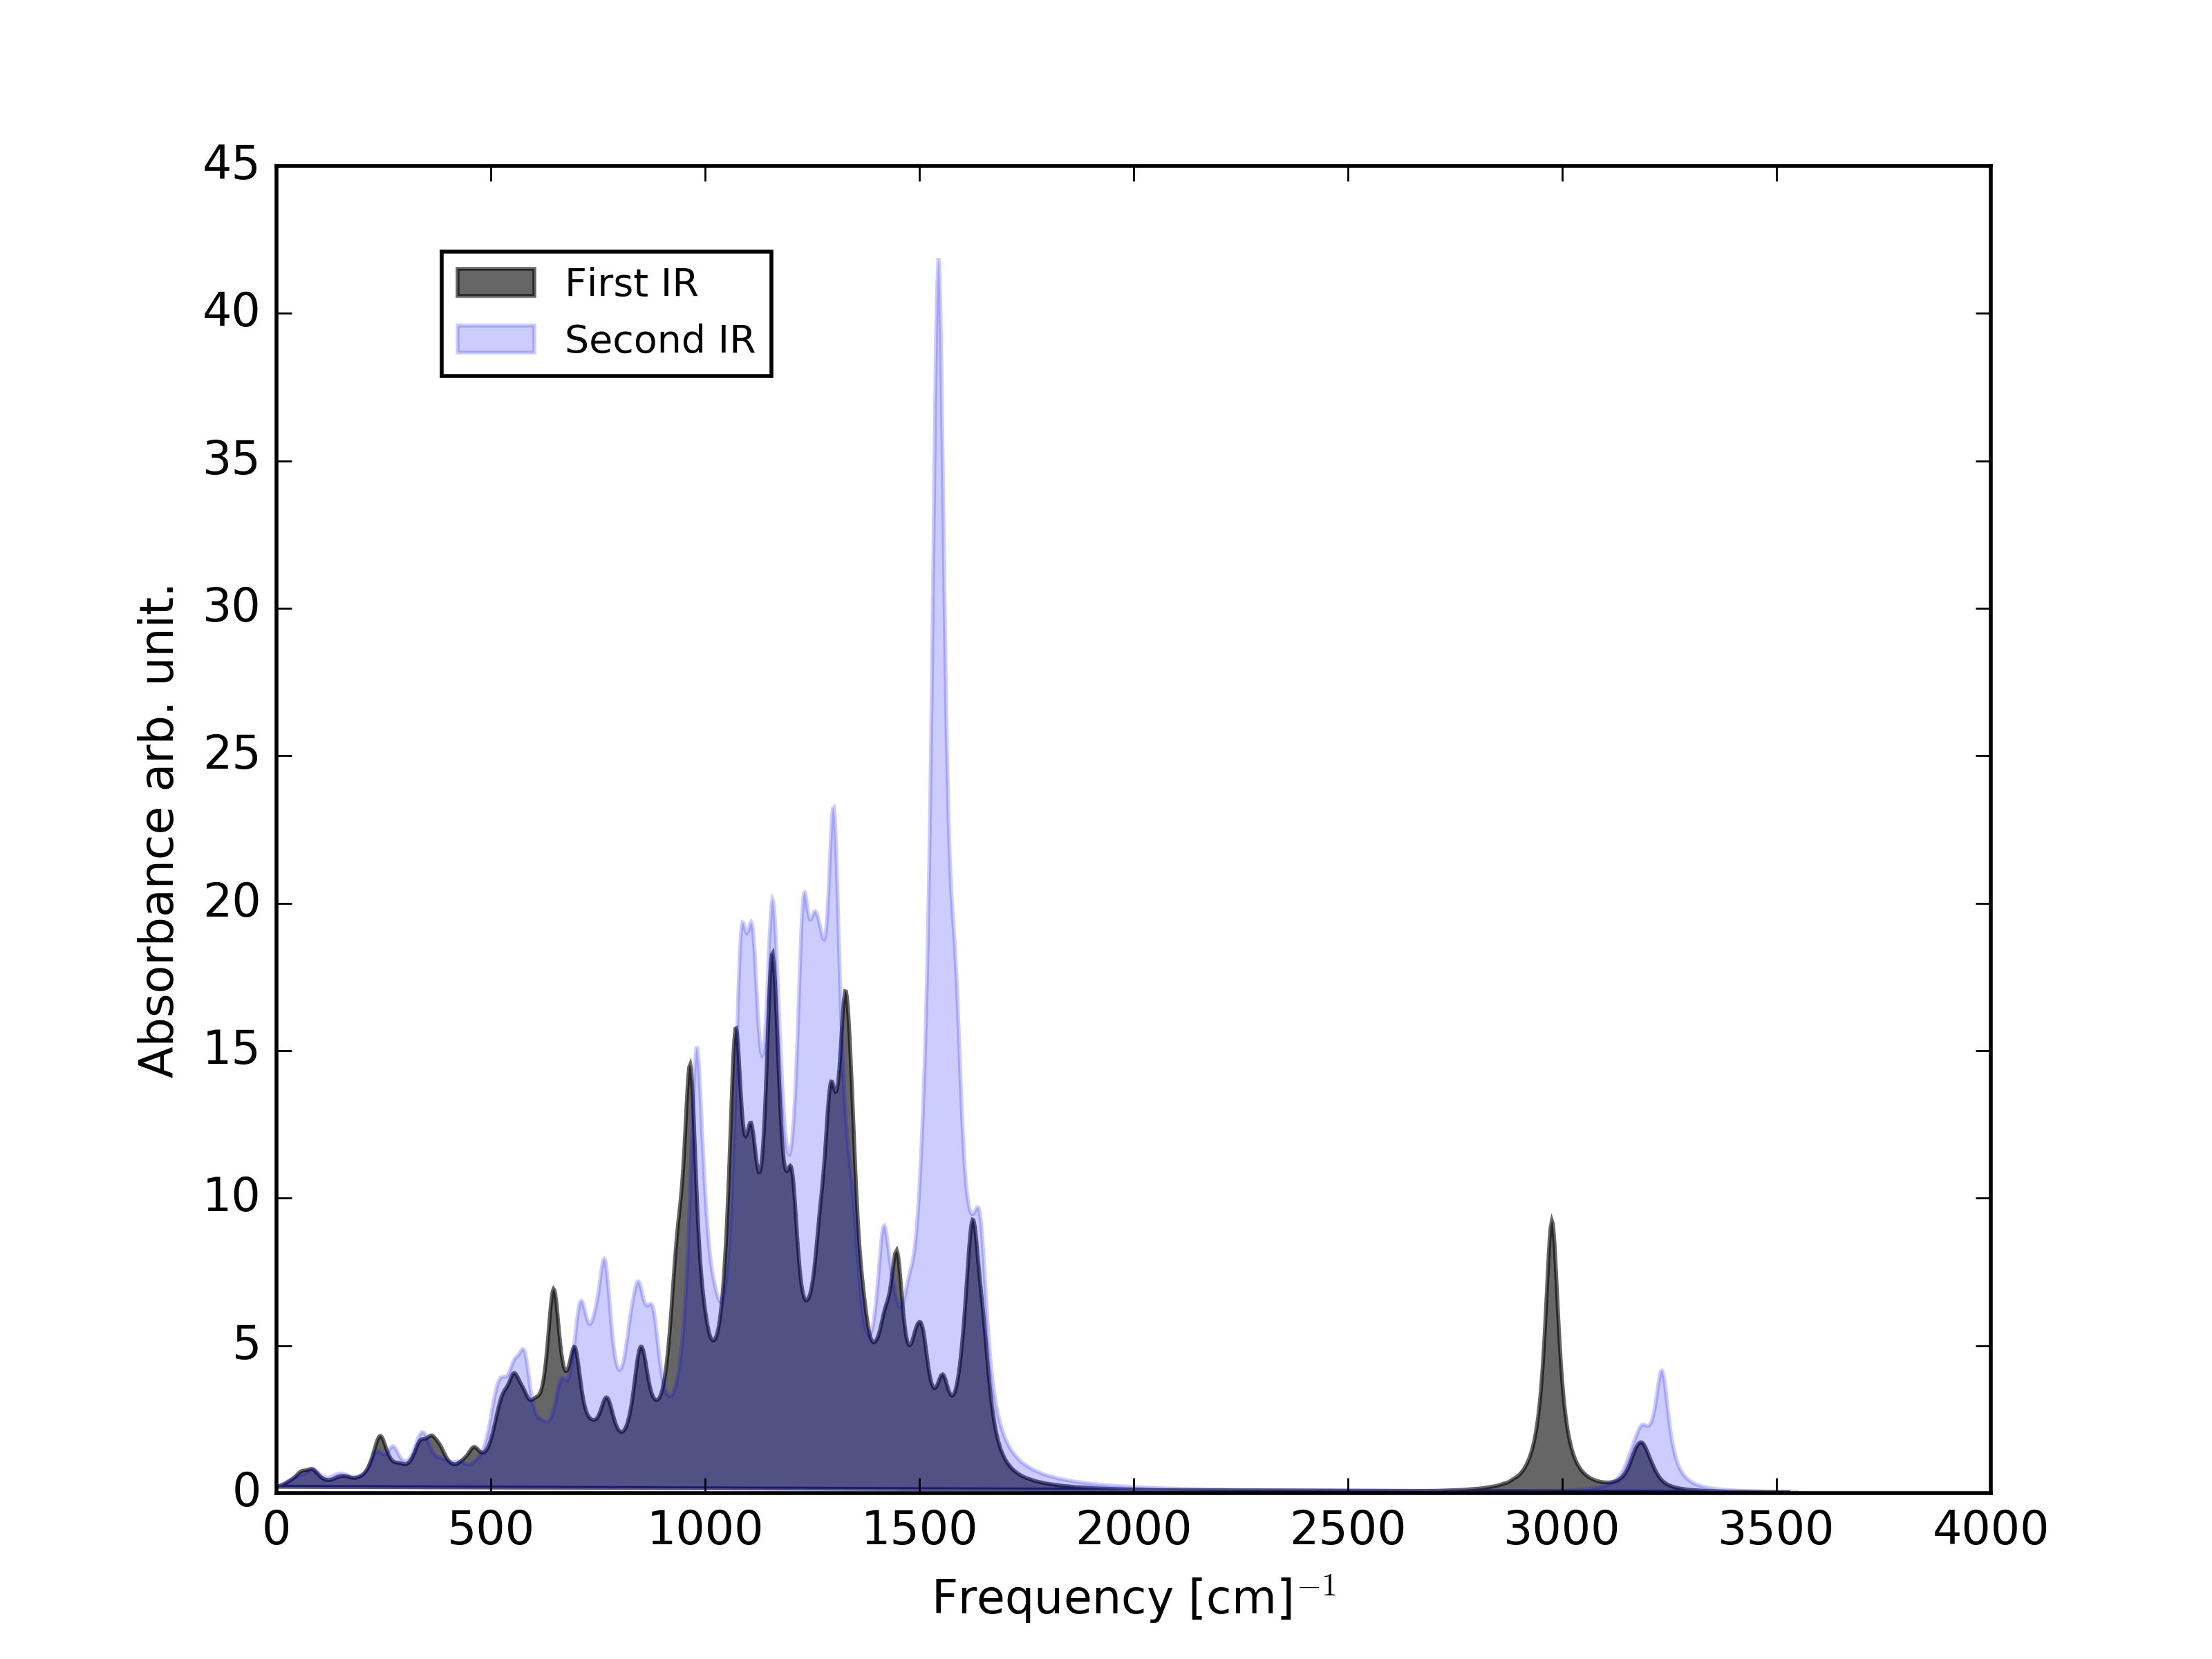
Filled Curve and line
To plot a filled curve we only have to use the fill instruction instead of plot.
#Plot Figure
#----------------------------------
fig = pl.figure(1)
ax1=pl.subplot()
ax1.fill(ir1[:,0], ir1[:,1], label=''First IR', alpha=0.6, color='black')
ax1.fill(ir2[:,0], ir2[:,1], label=''Second IR', alpha=0.2, color='blue')
Alpha controls the transparency ratio of the fill plot. It is very useful but at the sametime you will have to spend more time thinking on the best configuration.