Index
|
2.5 Raman Vibrations
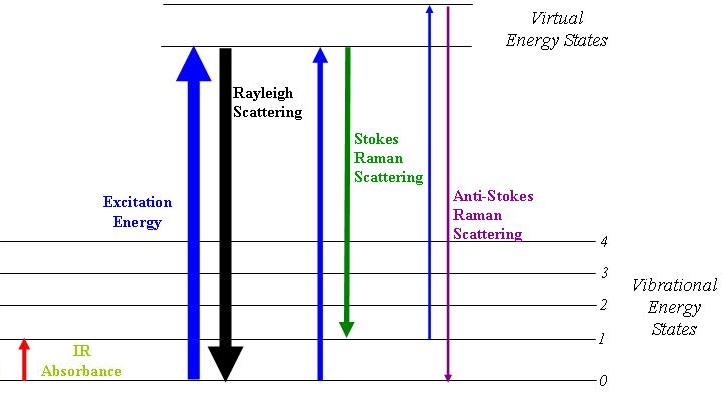
The Raman effect is based on molecular deformations in the electric field, determined by molecular polarizability. A perturbation in the polarizability (an electromagnetic wave) induces a change on the vibrational state of the molecule.
For polarizable molecules, the incident photon energy can excite vibrational modes of the molecules, yielding scattered photons which are diminished in energy by the amount of the vibrational transition energies. A spectral analysis of the scattered light under these circumstances will reveal spectral satellite lines below the Rayleigh scattering peak at the incident frequency.
Raman Spectrum is complementary of the IR spectrum, since it can detect some vibrational states that IR does not.
For more information you can check it on hyperphysics.phy-astr.gsu.edu and http://www.chemvista.org/ramanIR4.html
|
|
2.6 Raman Spectrum of the N-(methyl)mercaptoacetamide
To calculate a Raman Spectra we have to make a perturbation on the electric field properties of the molecule. To do that to our previous IR calculation we have to add a few lines.
%elprop Polar 1
Tol 1e-7
end
In addition to these lines we still have to perform the numerical frequencies analysis.
You have to get an input file like this: raman_a2mNm.inp |
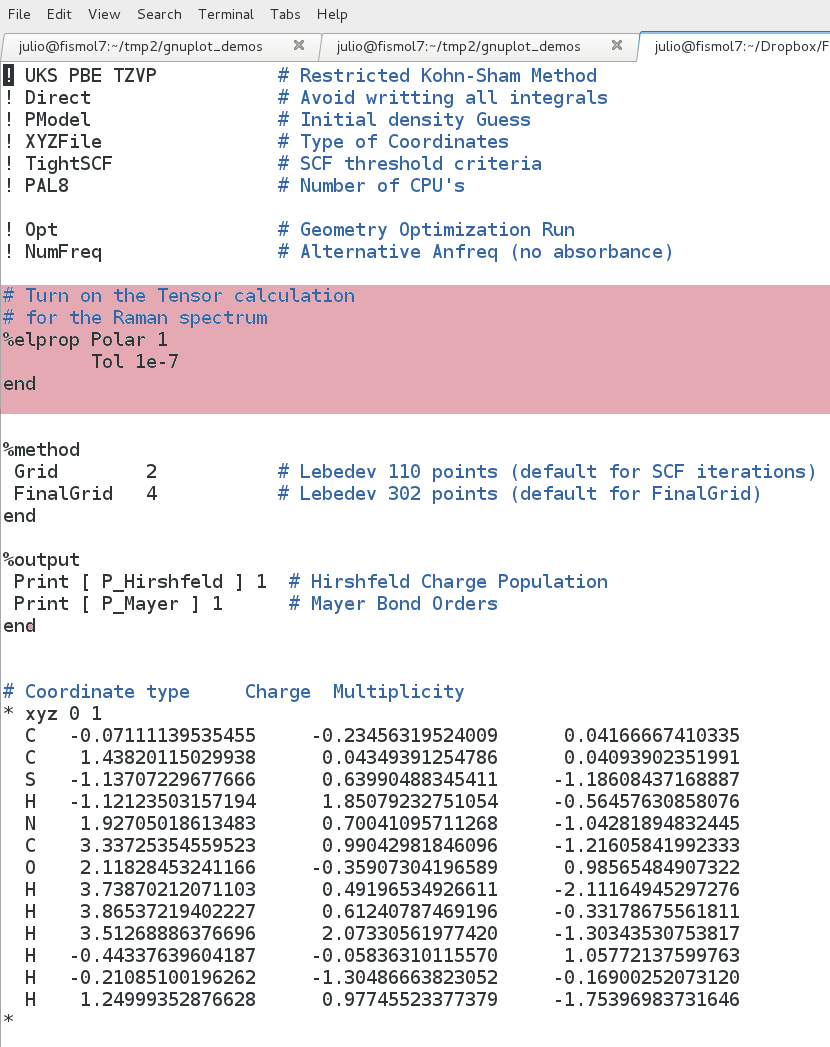
Figure 2.6. Raman input
|
2.7 Visualize the Raman Spectrum
Like the IR, there are two ways to visualyze the Raman spectrum, one is to use the ORCA utility to generate the Raman data, then you can plot this data with the program of your preference. To do this, on your work directory, you only have to type.
user@machine$ orca_mapspc file.out raman
This instruction will generate a file.out.dat file which can be plot, if you like to use gnuplot here is the script you have to use raman_style.p and you will get figure 2.7.1.
Also you can use ChemCraft visualizer, the only thing you have to do is to download the file.out on your hard drive and open it with the program.
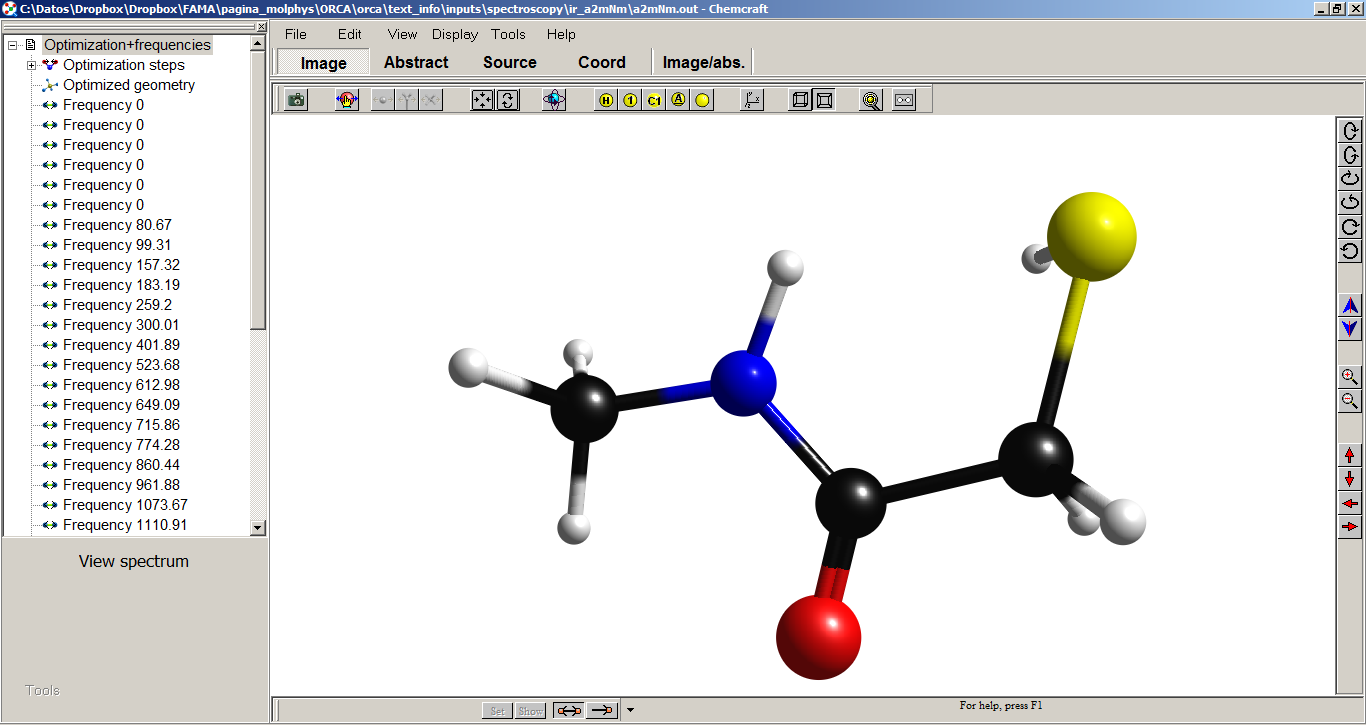
When you open the file on ChemCraft you will see this window.
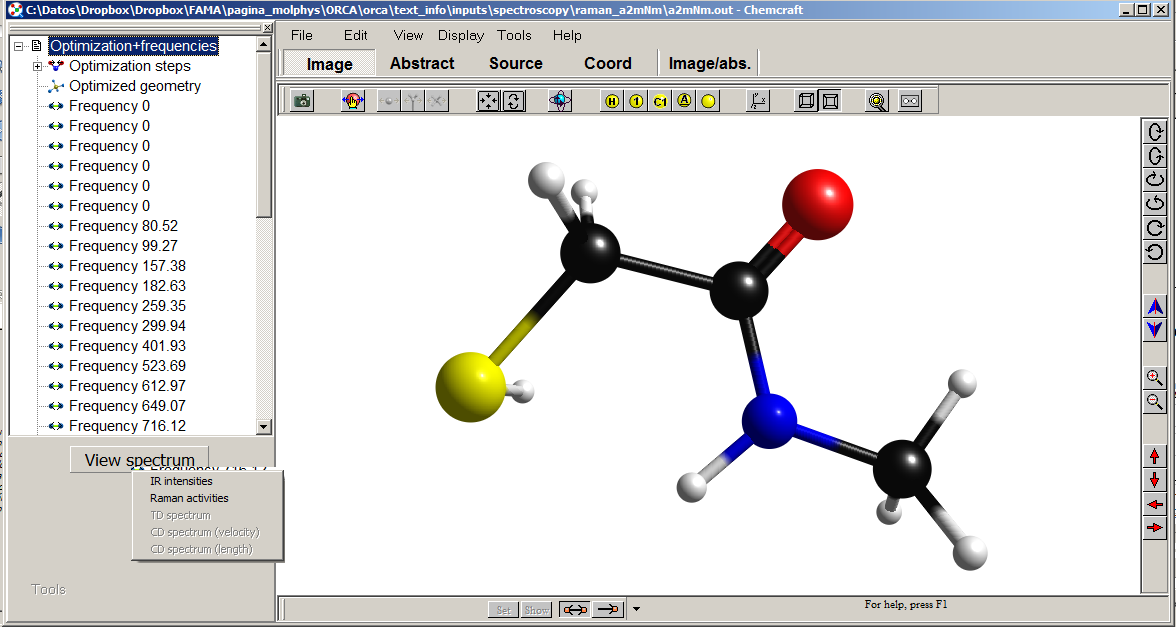
At your left you will see the navigation panel, this panel show the diferent optimizations or structural parameters you performed. If you select frequencies, at the bottom you will see a button "VIEW SPECTRUM" click on it and you will have both IR and Raman Spectra as shown here.
Here you have several tools to modify the appearance and scale of the raman spectrum as shown in figure.
If you click on the show peak button, ChemCraft will label the peaks with its frequency value. You can broader the band with too methods and modify their threshold.
|
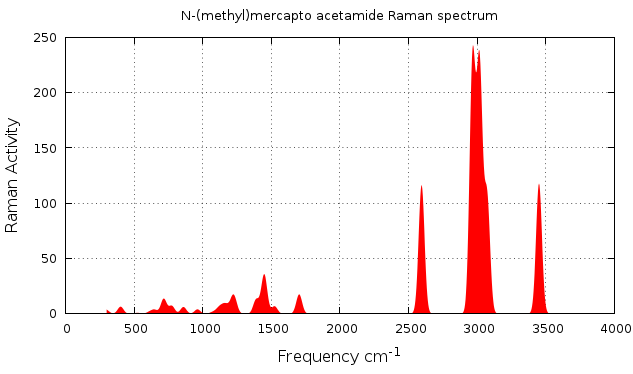
Figure 2.7.1 Raman spectrum plotted with Orca data
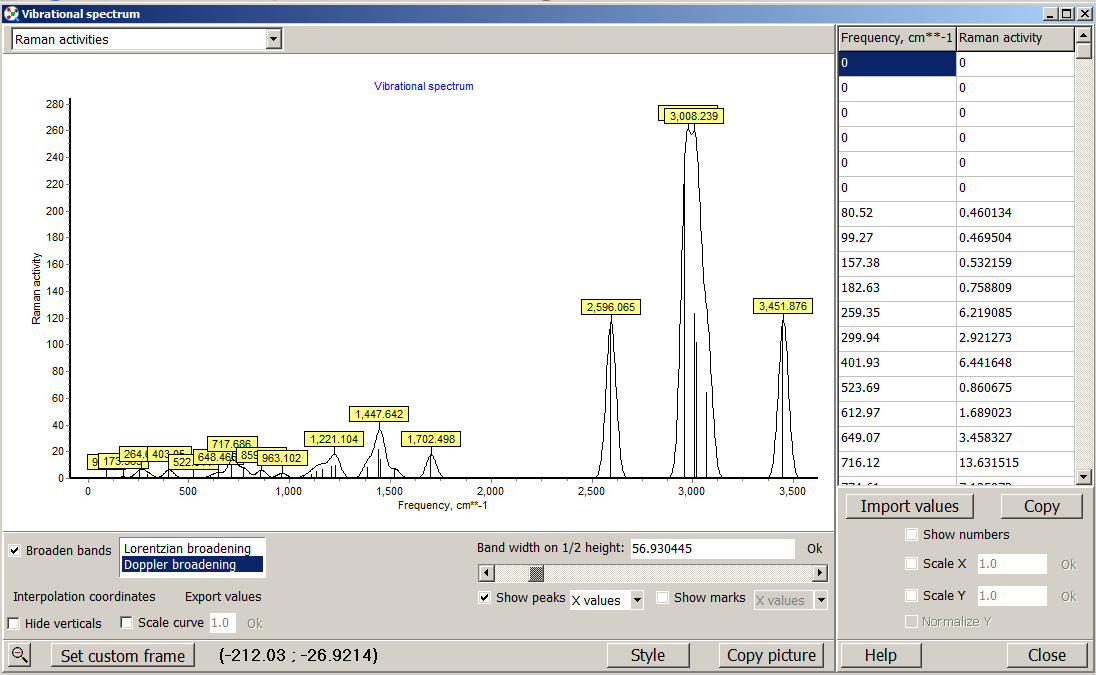 Figure 2.7.2 Raman spectrum visualized with ChemCraft
|
2.8 Normal modes of vibration
Figure 2.8.1 shows a comparison between the IR and Raman Spectra. We can see that IR do not show the normal mode of vibration of the mercapto group.
Lets the the normal vibration mode of the mercapto group.
Mercapto group exhibits a large peak on the range of 2400 - 2600 cm-1, choose the frequency of 2594 cm-1. If you do this you will get figure 2.8.2.
|
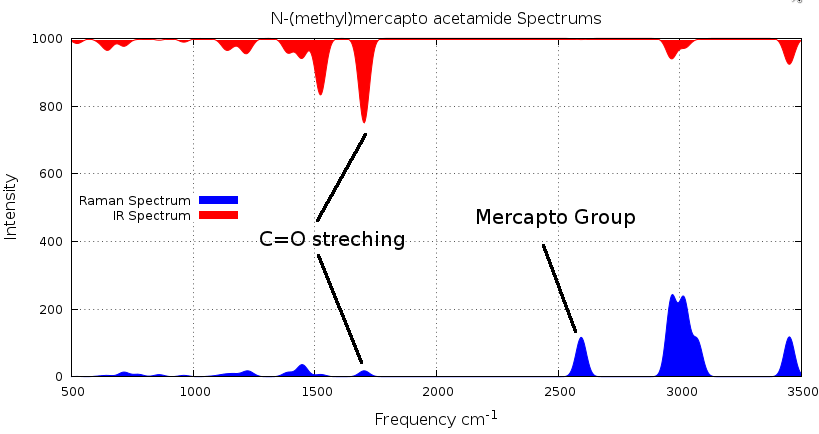 Figure 2.8.1. IR and Raman Spectrum
 Figure 2.8.2 Mercapto vibration (2594 cm-1)
|
|
