2. Spectroscopy
Theoretical Spectroscopy has become very useful to study and predict several aspects of the molecular properties.
|
 |
Frequencies Analysis (IR Spectra)
In DFT calculation this analysis is important, because it tell us if our proposed state is in a minimum (or a maximum) point on the Potential Energy Surface. This molecular vibrations depends on the second derivative of the energy with respect to the nuclear position
Also can give us a theoretical Infra Red Spectrum and the normal modes of vibration for each frequency peak.
To perform a Frequency analysis you have to include the next lines to the basic input.
!Opt
!AnFreq or !NumFreq
Analytical Frequencies consumes less computing time, but they do not deliver the possible absorbance intensities (in ORCA). Numerical Frequencies gives IR intensity which can be plot. We use ChemCraft to see the structure and the IR spectrum.
|
|
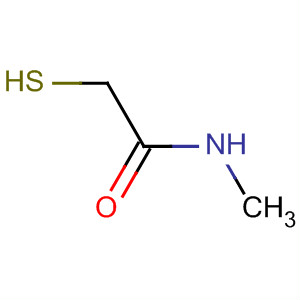
2.1 Frequency Analysis of N-(methyl)mercaptoacetamide
Lets perform an IR spectrum, please build the molecule, figure 2.1.1, on your favourite builder. Use this coordinates and create the input file.
The file most look like this a2mNm.inp
Modify the pbs file so that the name and the cpu's number agrees with the input file of orca. Pbs file most look like this orca-3.0.1.pbs
Please excecute the Orca program:
user@machine$ qsub orca-3.0.1.pbs
|
Figure 2.1.1. N-(methyl)mercaptoacetamide
|
2.2 OUTPUT
After the calculation is done, orca will deliver several files. You have to ensure the run finished succefully, to do that you have to search for the next character chain on the FILE.out.
/ORCA TERMINATED NORMALLY
The output file deliver all properties you requested on the input file, here are some important output parameters.
/Total Energy -> Shows the Sum of all energies and also the contribution of them.
/HIRSHFELD -> Charge distribution proposed by Hirshfeld
/MAYER -> Mayer Bond Orders
/ORBITAL -> Orbital energies
/Dipole Moment->Total Dipole moment and its decomposition
/VIBRATION -> Vibrational Frequencies
|
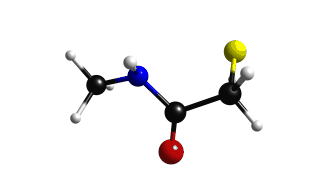
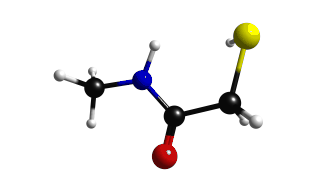
Figure 2.2.1 Optimized Structure
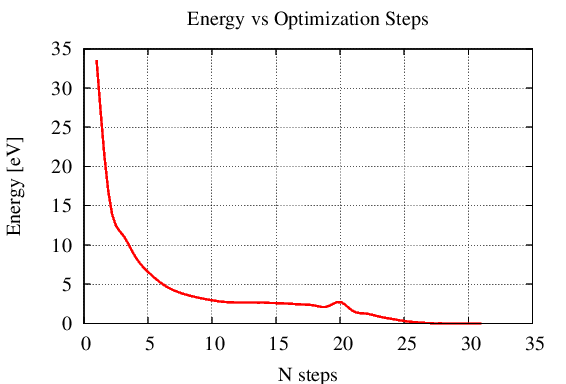 Figure 2.2.2 Energy vs Optimization Step
|
2.3 IR Spectrum
There are two ways to visualyze the IR spectrum, one is to use the ORCA utility and to generate the IR data, then you can plot this data with the program of your preference. To do this, on your work directory, you only have to type.
user@machine$ orca_mapspc file.out ir
This instruction will generate a file.out.dat file which can be plot, if you like to use gnuplot here is the script you have to use ir_style.p. You will get figure 2.3.1.
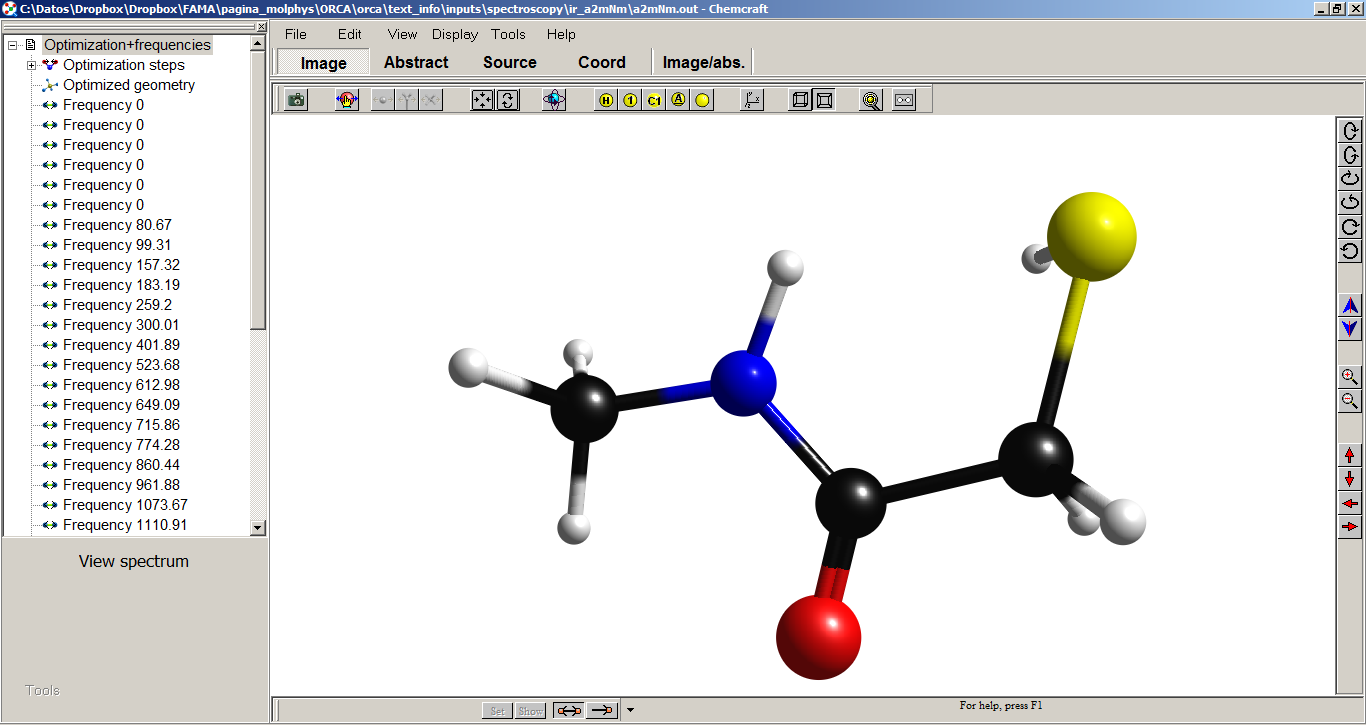
Also a easier and handy method is to use ChemCraft visualizer, the only thing you have to do is to download the file.out on your hard drive and open it with the program.
When you open the file on ChemCraft you will see this window.
At your left you will see the navigation panel, this panel show the diferent optimizations or structural parameters you performed. If you select frequencies, at the bottom you will see a button "VIEW SPECTRUM" click on it, and you will have the IR spectrum of figure 2.3.2
Here you have several tools to modify the appearance and scale of the spectrum.
If you click on the show peak button, ChemCraft will label the peaks with its frequency value. You can broader the band with too methods and modify their threshold.
|
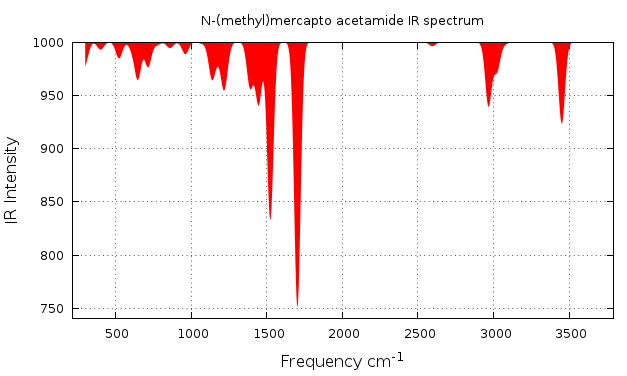
Figure 2.3.1 IR spectrum ploted with orca data
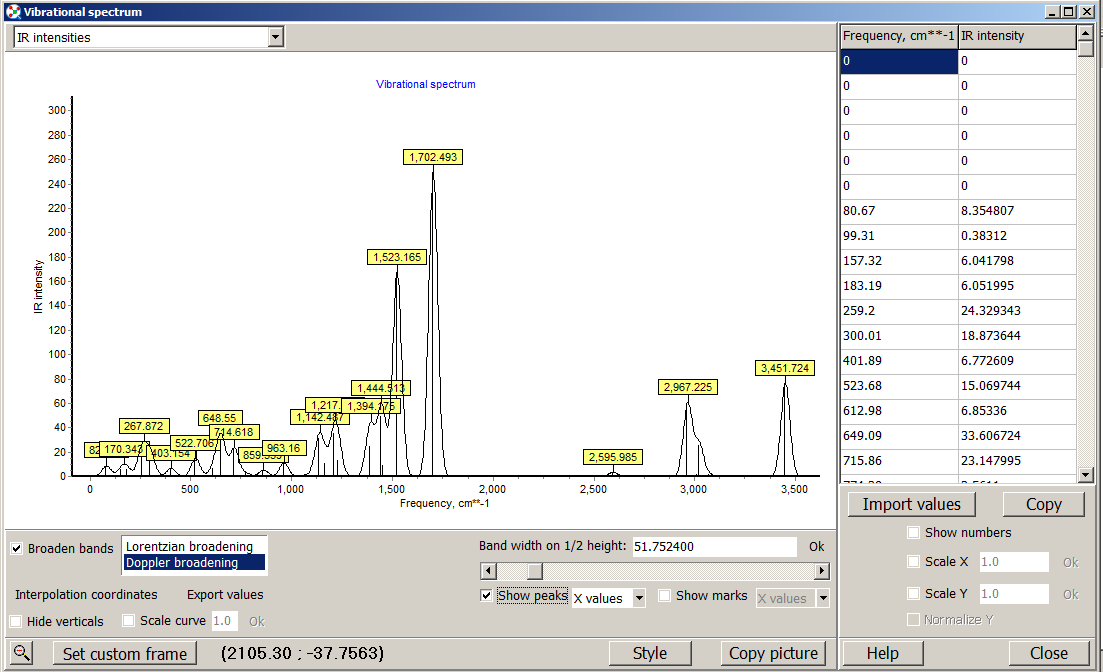 Figure 2.3.2 IR spectrum visualized with ChemCraft
|
2.4 Normal modes of vibration
To identify which is the normal mode of vibration of the corresponding peak, in your navigation panel, you only have to choose the frequency you want to see. For example lets see the vibration of the methyl group. Methyl group vibrates on the range of 1350 - 1470 cm-1, lets choose the frequency of 1390 cm-1. If you do this you will get figure 2.4.1.
|
Figure 2.4.1 Methyl vibration (1390 cm-1)
|
